Summary: in this tutorial, you have learned how to use the PostgreSQL EXPLAIN statement to display the execution plan of a statement.
Introduction to PostgreSQL EXPLAIN statement
The EXPLAIN statement returns the execution plan which PostgreSQL planner generates for a given statement.
The EXPLAIN shows how tables involved in a statement will be scanned by index scan or sequential scan, etc., and if multiple tables are used, what kind of join algorithm will be used.
The most important and useful information that the EXPLAIN statement returns are start-cost before the first row can be returned and the total cost to return the complete result set.
The following shows the syntax of the EXPLAIN statement:
EXPLAIN [ ( option [, ...] ) ] sql_statement;Code language: CSS (css)where option can be one of the following:
ANALYZE [ boolean ]
VERBOSE [ boolean ]
COSTS [ boolean ]
BUFFERS [ boolean ]
TIMING [ boolean ]
SUMMARY [ boolean ]
FORMAT { TEXT | XML | JSON | YAML }Code language: JavaScript (javascript)
The boolean specifies whether the selected option should be turned on or off. You can use TRUE, ON, or 1 to enable the option, and FALSE, OFF, or 0 to disable it. If you omit the boolean, it defaults to ON.
ANALYZE
The ANALYZE option causes the sql_statement to be executed first and then actual run-time statistics in the returned information including total elapsed time expended within each plan node and the number of rows it returned.
The ANALYZE statement executes the SQL statement and discards the output information, therefore, if you want to analyze any statement such as INSERT, UPDATE, or DELETE without affecting the data, you should wrap the EXPLAIN ANALYZE in a transaction, as follows:
BEGIN;
    EXPLAIN ANALYZE sql_statement;
ROLLBACK;
VERBOSE
The VERBOSE parameter allows you to show additional information regarding the plan. This parameter sets to FALSE by default.
COSTS
The COSTS option includes the estimated startup and total costs of each plan node, as well as the estimated number of rows and the estimated width of each row in the query plan. The COSTS defaults to TRUE.
BUFFERS
This parameter adds information to the buffer usage. BUFFERS only can be used when ANALYZE is enabled. By default, the BUFFERS parameter set to FALSE.
TIMING
This parameter includes the actual startup time and time spent in each node in the output. The TIMING defaults to TRUE and it may only be used when ANALYZE is enabled.
SUMMARY
The SUMMARY parameter adds summary information such as total timing after the query plan. Note that when ANALYZE option is used, the summary information is included by default.
FORMAT
Specify the output format of the query plan such as TEXT, XML, JSON, and YAML. This parameter is set to TEXT by default.
PostgreSQL EXPLAIN examples
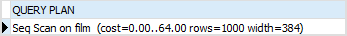
The following statement shows the plan for a simple query on the film table:
EXPLAIN SELECT * FROM film;The output is as follows:
The following example shows the plan for a query that returns a film by a specific film_id.
EXPLAIN SELECT * FROM film WHERE film_id = 100;Here is the output:
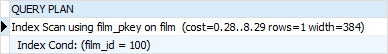
Because the film_id is indexed, the statement returned a different plan. In the output, the planner used an index scan instead of a sequential scan on the film table.
To suppress the cost, you can use the COSTS option:
EXPLAIN (COSTS FALSE) SELECT
    *
FROM
    film
WHERE
    film_id = 100;Code language: PHP (php)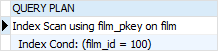
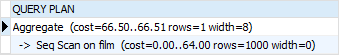
The following example displays the plan for a query that uses an aggregate function:
EXPLAIN SELECT COUNT(*) FROM film;The output is:
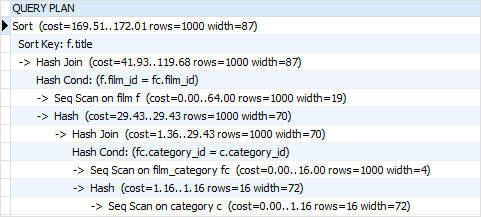
The following example returns a plan for a statement that joins multiple tables:
EXPLAIN
SELECT
    f.film_id,
    title,
    name category_name
FROM
    film f
    INNER JOIN film_category fc
        ON fc.film_id = f.film_id
    INNER JOIN category c
        ON c.category_id = fc.category_id
ORDER BY
    title;
The output is:
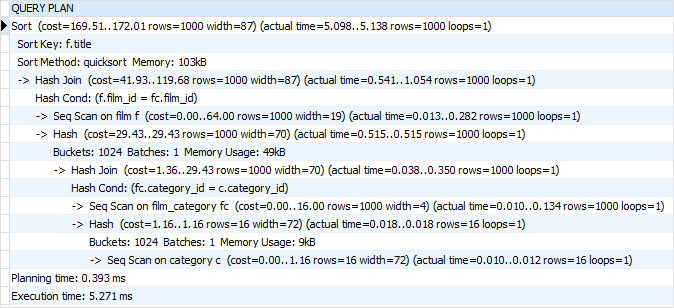
To add the actual runtime statistics to the output, you need to execute the statement using the ANALYZE option:
EXPLAIN ANALYZE
    SELECT
        f.film_id,
        title,
        name category_name
    FROM
        film f
        INNER JOIN film_category fc
            ON fc.film_id = f.film_id
        INNER JOIN category c
            ON c.category_id = fc.category_id
    ORDER BY
        title;
Here is the output:
In this tutorial, you have learned how to use the PostgreSQL EXPLAIN statement to show the query’s plan for a specific SQL statement.